Introduction to Adtrack by KANTAR
Adtrack, measuring TV advertising’s effectiveness
|
| Given this tough environment, it has become more important than ever to understand not only how your advert is performing, but also the landscape it is competing in. |
|
Kantar’s Adtrack system is the most comprehensive and sophisticated post-launch evaluation and planning efficiency
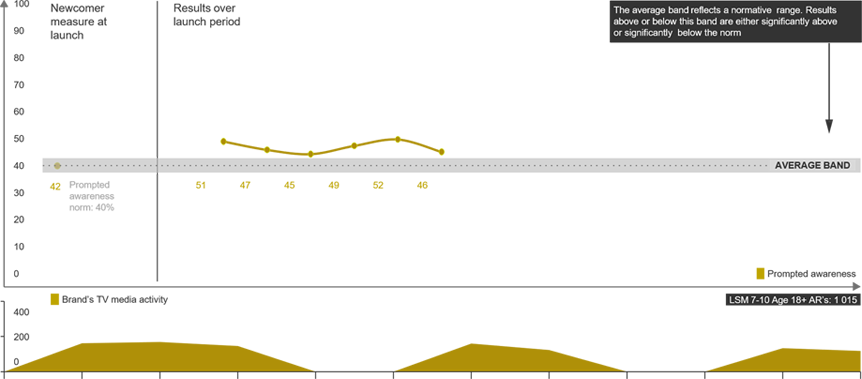
The value of ensuring the correct media weight at launch is crucial, as this provides a solid foundation for optimal flighting
|
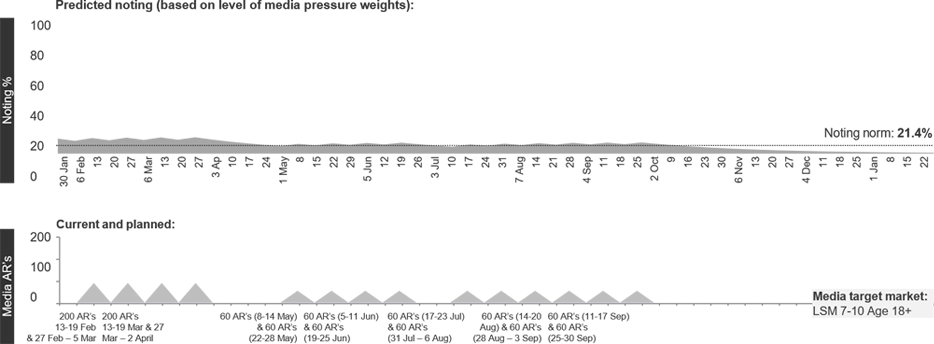
Noting levels by different media pressure levels market segment X |
|
| In addition to launch weight benchmarks, we also analyse the competitor media environment over the campaign period to better understand the context of the other ads yours competed against. To better understand the ad’s performance, we will look at share of voice, as well as the role of the station mix in the campaign launch. |
|
Gauging how well a campaign performs in-market: |
|
|
These awareness and noting levels are compared against category norms to see whether the campaign performed above or below the benchmarks. |
|
Understanding the creative |
|
|
All ads have a strategic role to play in driving the desired messaging, however these measures help ads to cut through the clutter, if given sufficient media weight. |
|
Understanding is one thing, but how can Kantar help you optimise for the future? |
|
These are then compared to other adverts within the client’s competitive set and plotted on the impact-retention chart, which is used as a strategic tool to guide client’s future flighting strategies. |
We also need to measure the creative and compare it against benchmarks, to fully understand the advert’s performance in market.
|
Branding |
|||||
|
|
|||||
|
Title |
Ad |
Norm |
|||
|
Couldn’t fail to remember |
|
20 | |||
|
Quite good at making you remember |
|
30 | |||
|
Not all that good |
|
20 | |||
|
For any brand |
|
-20 | |||
|
Could be for anything |
|
-10 | |||
|
Engagement |
||||||||||
|
|
||||||||||
|
Ad total sample |
XXX |
|||||||||
|
Norm |
XXX |
|||||||||
|
|
||||||||||
|
Communication |
|
|
|
|
|
Ad total sample |
XX% |
|
Total impressions |
XX% |
|
Campaign norm |
XX% |
 |
|
|
The Adtrack Media Optimiser tool is then used to simulate the client’s marketing parameters, to establish the most efficient and effective future flighting strategy. |
|
|
|
 |
 |
|
|||||||
|
|
Norm is based on LSM 5-6 or LSM 7-10. The results are sig tested to determine if the advert and key competitors are performing significantly above or below norm | |||||||
Get in touch with any questions, or to book a free consultation. |
||